FramePro 1.10.13 (x64) + crack (DeGun)
- CategoryApps
- TypePC Software
- LanguageEnglish
- Total size22.7 MB
- Uploaded ByDeGun
- Downloads17
- Last checkedSep. 15th '22
- Date uploadedSep. 14th '22
- Seeders 3
- Leechers1

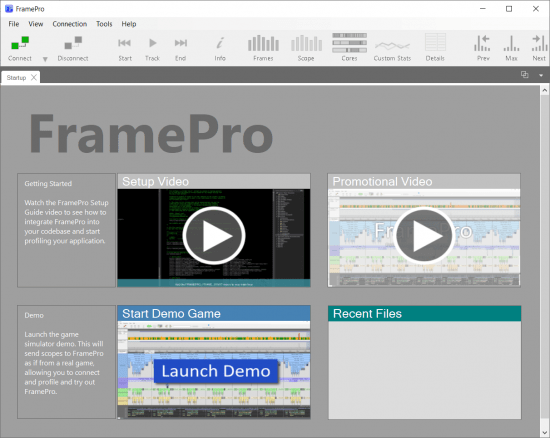
Integrate FramePro into your codebase in minutes - simply add FramePro.cpp/h into your code and start adding scopes. Add timing scopes using the supplied macros to any function or block of code. FramePro will then track the time, thread and core of each scope. This scope information will be sent to the FramePro application, where thread and core utilization can be viewed for each frame.
Getting Started
Integrate FramePro into your codebase in minutes - simply add FramePro.cpp/h into your code and start adding scopes. Add timing scopes using the supplied macros to any function or block of code. FramePro will then track the time, thread and core of each scope. This scope information will be sent to the FramePro application, where thread and core utilization can be viewed for each frame.
Why FramePro?
FramePro has minimal overhead. When profiling, the first rule is to not change the behavior of what is being profiled. FramePro allows you to add thousands of timing scopes per frame with no noticeable impact on frame rate.
Profile in real-time. In interactive mode you can see the data as it is being recorded, easily spot a frame rate spike, and immediately zoom in to that frame to find the cause.
No limit to the length of a capture. Unlike many profilers which can only capture a few seconds worth of data, FramePro can capture long play sessions.
Framepro uses the highest resolution timer available on your system. It is configured for many platforms and easily configurable.
FramePro is easy and intuitive to use. Everyone who sees FramePro in action immediately 'gets it'. FramePro can be used by programmers and non-programmers alike.
How it works
Call the FRAMEPRO_FRAME_START() macro at the start of your frame. This tells FramePro when the frame starts and ends and this will be marked on the timeline in both the thread and code view. This simple feature is one which many profilers lack.
Use the FRAMEPRO_SCOPE() macro to time a function call. This creates an object on the stack that records information. In its constructor it records the start time using the high resolution system timer. In its destructor it records the end time, the current thread id, the current CPU core, and the current function name. This information is then copied onto a thread local storage (TLS) buffer. These TLS buffers are sent once a frame on a separate thread.
The scope recording code is minimal and consists of only a few instructions. The thread local storage means that there is no locking or contention with other threads. The function name string is a string literal, and the only value that is sent to FramePro is the pointer. The actual string value is resolved later. All this means that there are only a few instruction per scope, and only a few bytes of data is copied to the send buffer. this allows you to add thousands of scopes per frame without affecting frame rate.
There are a number of different scope macros. If you want to name a scope use FRAMEPRO_NAMED_SCOPE("MyScope"). You can also send dynamic (non-literal) strings using FRAMEPRO_DYNAMIC_SCOPE(). to scope idle processor time, such as in an event wait, use FRAMEPRO_IDLE_SCOPE(). This will show up in a different colour in FramePro. Use the conditional scopes to only show the scope if it is longer than a specified time. This time can be dynamically changed in FramePro while recording. The scope macros are fully documented in FramePro.h.
FramePro can run in connected or offline mode. When running in connected mode your application will send data using sockets every frame. FramePro will then display the data as it is received. You can pause the data and inspect frames at any time while recording. If you don't want the overhead of FramePro on your system you can run in non-interactive mode and it will take up almost no CPU. This is useful when profiling on the same PC as you are running the application. For best results, it is recommended that you run your application/game on a different PC or Console and then connect in interactive mode.
If your codebase doesn't support sockets or you can't connect for some other reason you can run FramePro in offline mode and all network data will be written to a .framepro_dump file. This file can then be loaded into framepro.
Integrate FramePro into your codebase in minutes
FramePro allows you to add thousands of timing scopes per frame with no noticeable impact on frame rate
The scope recording code is minimal and consists of only a few instructions
FramePro will display the profile data as it is received. You can pause the data and inspect frames at any time while recording.
https://www.virustotal.com/gui/file-analysis/MGVjOWI4OWRiYWM5MDYyOTAwYzc1Y2UzM2M1MmEyNDg6MTY2MzExNTgyNQ==
https://www.virustotal.com/gui/file/5b137b6b0aa370971321929e2f0f3c7308488420aaec6b50d8739bfb46eef66c?nocache=1
Files:
FramePro 1.10.13 (x64)- crack.zip (1.1 MB)
- FramePro_x64_setup.exe (21.7 MB)
Code:
- udp://tracker.openbittorrent.com:80/announce
- udp://tracker.opentrackr.org:1337/announce
- udp://tracker.pirateparty.gr:6969/announce
- udp://tracker.tiny-vps.com:6969/announce
- udp://tracker.torrent.eu.org:451/announce
- udp://explodie.org:6969/announce
- udp://ipv4.tracker.harry.lu:80/announce
- udp://open.stealth.si:80/announce
- udp://tracker.coppersurfer.tk:6969/announce
- udp://tracker.cyberia.is:6969/announce
- udp://tracker.internetwarriors.net:1337/announce
- udp://tracker.open-internet.nl:6969/announce
- udp://tracker.zer0day.to:1337/announce
- udp://tracker.leechers-paradise.org:6969/announce
- udp://tracker.zer0day.to:1337/announce
- udp://tracker.leechers-paradise.org:6969/announce
- udp://coppersurfer.tk:6969/announce
